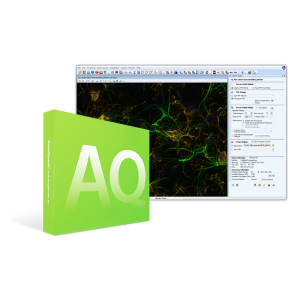
Media Cybernetics 3D Module with Big Data Visualization
£7,695.00 Ex. VAT
Image-Pro is an image analysis software platform that delivers intuitive tools that make it easy to capture, process, measure, analyze and share your images and valuable data. Add one or more of the Image-pro modules to expand the functionality of the platform to match your needs.
Image-Pro modules allow you to enhance your software with additional features and functionality.
Add the Image-Pro 3D Module with Big Data Visualization to your platform and unleash a new level of Image Analysis for your research. Advanced 3D Visualization and Analysis options based on the same philosophy as the Image-Pro platform allow to you perform complex analysis methods without learning a new platform.
Add the 3D Module to your system today!
3D/4D View
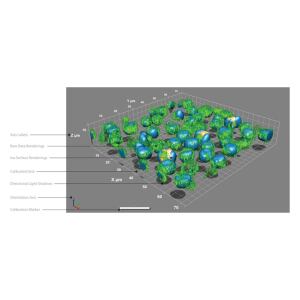
Visualize your 3D volumes or 4D time-lapse data in stunning high-resolution full screen views.
Slicer View
Explore every voxel using this 2D projection mode that links the position of the 2D plane to a real 3D position on the integrated 3D view.
Gallery View
See every frame that makes up the volume in a gallery of thumbnails able to be scaled, edited, adjusted or simply viewed in this mode.
Big Data Visualization Module
The ability to visualize your sample is an important aspect of your research. This has become more and more challenging with the expansion of high-volume imaging techniques, such as Light Sheet and FIB-SEM. The Image-Pro 3D Module for Big Data Visualization offers all the functionality of the standard Image-Pro 3D Module but with the ability to display Large Volumes easily by using a combination of GPU processing with your current system to easily display large data sets*.
Click the Request Quote button below to begin viewing large 3D images with the Image-Pro 3D Module for Big Data Visualization.
Large Images will require disk space
- *File size is limited to the Hard Drive Free Space/2.5. For suggested specifications please refer to the system requirements for Image-Pro 3D Module.
- Example: 4TB Free Space/2.5=1.6 TB file, should use a 6TB drive
- GEForceGTX or above cards with 8GB RAM
- 48GB-100GB RAM, depends on # of images
Measure Complex 3D Objects
Guided Segmentation is designed to enable the identification and measurement of any 3D Object using a simplified guided process that excels over current 3D segmentation techniques
Generate Outlines
Use any 2D frame to define objects as unique collections of outlines. Name and color code them for clarity.
Z Propagation
Propagate the segmentation up or down through the stack, using Auto or Semi-Auto techniques and review the outlines for edits as needed
Isosurface Creation
Automatically generate isosurfaces from your collection(s) of outlines. Measure volume, surface, intensity, and unique morphological object measurements.
Adjustments and Measurements
Adjust lighting, appearance, surfaces on volumes, objects, and channels to display the results. Add manual measurements and annotations to accompany visual enhancements and combine look and data into a single, impactful presentation.
Manual Adjustments
Volume Adjustments
- Blend, MIP, and Sum Projections
- Overall Volume Transparency
- Wireframe & Isosurface Renderings
- Slice Density and Edge Colouring
- Pseudo-Surface and Stereo Views
Object Parameters
- LUT-based Spread and Opacity
- Individual Object Specularity
- Colour Palette Editor & Presets
- Light Sources and Shadows
Channel Parameters
- Retain native channel colouring
- Toggle or Blink each channel
- Opacity weighted auto blending
- Independent histogram edits
- Channel extraction or Merging
Manual Measurements
Easily quantitate physical measurements of your isolated objects and standardize them for your analysis protocol to target discrete objects of interest.
Distances, Areas, Volumes
- 3D Centroids,
- Surface Area
- Circumferences
- Distance between objects
- 3D lengths from surface to centre
- 3D lengths following along an object’s surface
Centroids, Angles, Contours
- 3D Object Contours using 2D polylines on slices
- X,Y,Z Size, Shape, Orientation and Intensities
- X,Y,Z coordinates at any 3D location
- Distance between objects, and merge/split
- Relative Angles between lines
- Relative Angles to reference vectors
Automated Measurements
Apply automated measurements to objects to easily release the full potential of your data. Develop your analysis model and combine data collector with batch processing to analyse large amounts of data in a few clicks.
Set Data Collection
With the press of a button all the data from your table is compiled into Data Collector. You can even set it up to collect from all images automatically as they are measured.
Link Collected Data to Images
For a multi-image experiment, collect large clusters of data from each image separately and retain the original links to understand how image groups compare and contrast.
Graph the results
Use a variety of graph types for your data such as 2D and 3D scatterplots, histograms, block charts and lines graphs.
Filter by Measurement
With any of the chosen measurements, create a histogram of your segmented regions and only keep what you find relevant, excluding the rest using multiple precise parameters such as a combination of morphology and intensity measurements.
Classify by Measurement
Using an automatic classification method, bins of classes can be created and applied to all the measured objects in the data graph. Use this to easily colour-code and classify object in the view and on the data tables and graphs
Sort and Condense
Sort by measurements and adjust tables to only show the relevant data.
Group Results and View Statistics
Combine classes of similar objects into a custom hierarchy and see statistics per measurement for each grouped class.
Produce and Share
Generate movies by key frame annotations, add clipping, y-throughs and annotations to enhance your project. Export them easily and share them with colleagues or add a frame to enhance your report.
Key Frame Animations
Powerful animation tools enabling the creation of realistic movies comprised of complex movements & renderings.
Pre-loaded Templates
- Circular Animation
- Flye-Around Animation
- See-saw Animation
Custom Animations
- Record camera position, angle and zoom
- Add and Replace positions
- Record volumes, surfaces and object counts.
- Record Oblique or Ortho clipping planes
- Improve quality with smoothing and Anti-Aliasing options
Sharing
- Save and Load Animation
- Paths for future use
- Generate identical movies
- Save as WMV, AVI and MP4
Additional information
| Manufacturer |
|---|
Only logged in customers who have purchased this product may leave a review.


Reviews
There are no reviews yet.